IRTG Course
Introduction to R for genomics
Carl Herrmann & Carlos Ramirez
8-9 December 20210. First steps in scRNA-Seq analysis {#intro}
We will use available data from 10X genomics of Peripheral Blood Mononuclear cells (PBMC). In order to speed up the process only a subset of 500 cells are going to be processed here. Here, we will perform the following tasks:
- Definition of a Seurat object from a matrix of counts
- Quality Control (QC) of the cell samples
- Filtering
- Dimensional reduction
- Clustering
- Differential expression
- Visualization of markers
Single Cell Sequencing
Single cell sequencing (scRNA-Seq) technologies arise from bulk counterparts with the aim of refining gene expression profiles. Previous bulk Sequencing offered averaged quantifications of gene expression in samples. In some contexts, for example, when studying cell type specificity or the heterogeneity in tumours is important to dissect patterns in cell subpopulations.
The following image illustrates the development of scRNA-Seq technologies and the number of cells that can be analyzed with each technology. In this course we will not discuss platform sequencing technologies in detail, instead we will take a hands on approach and jump directly to the analysis of scRNA-Seq data. However, the analysis that we show next are applied downstream to libraries construction or sequencing, and are therefore platform agnostic.
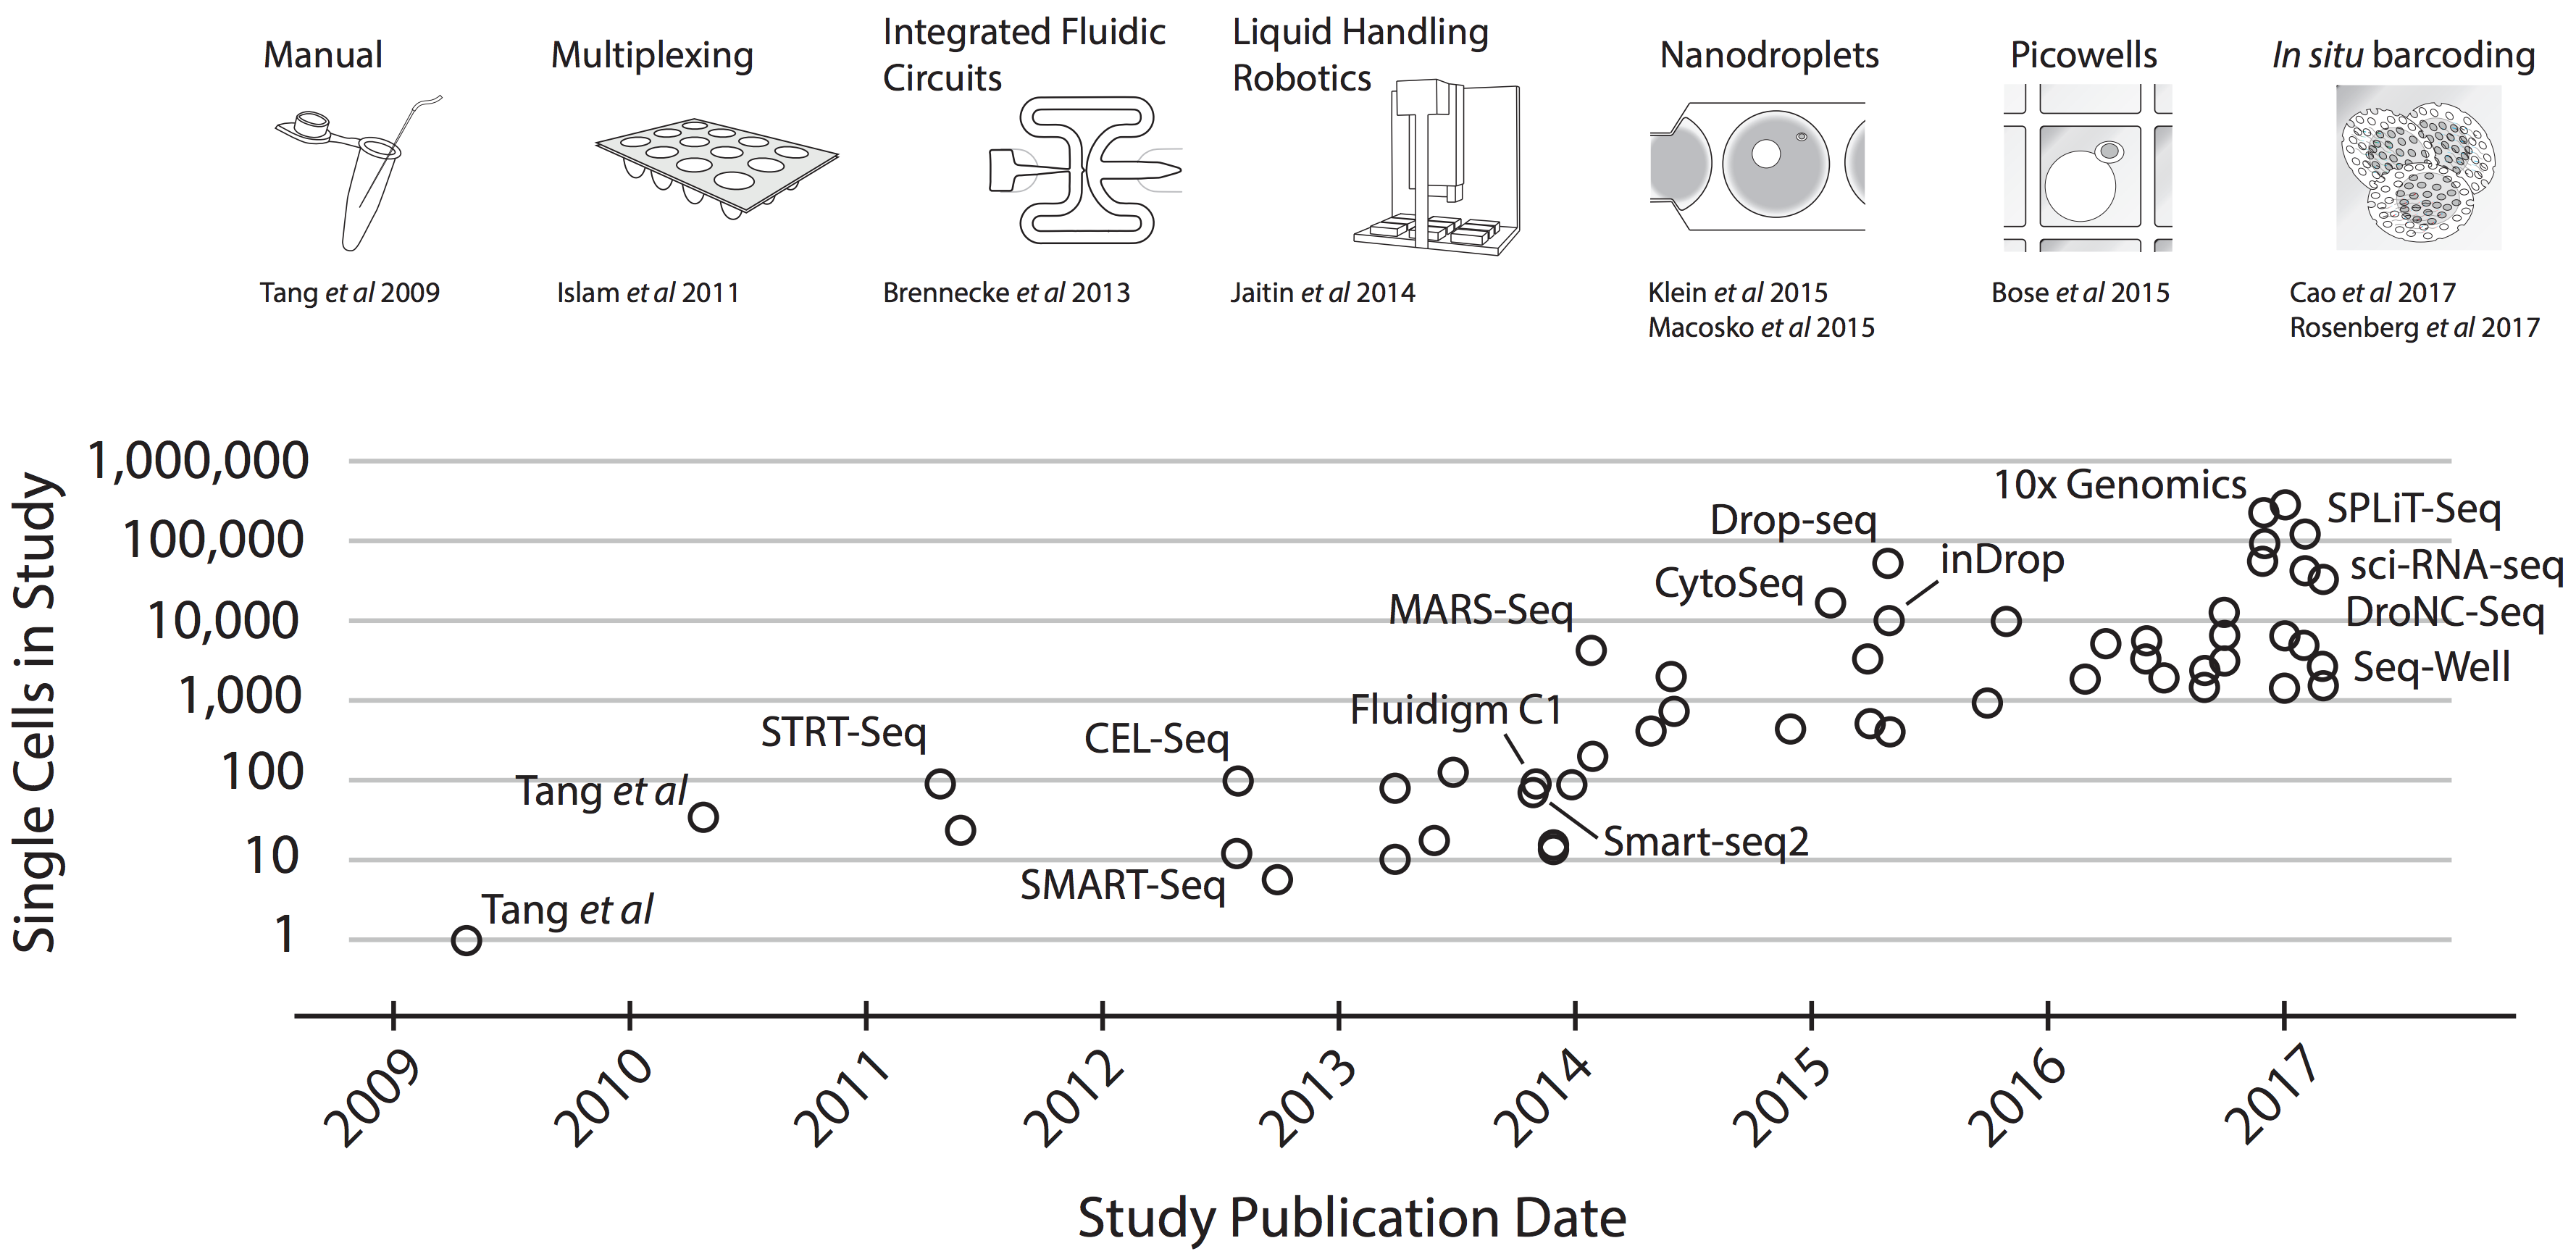
The image is taken from Svensson V et al, 2017.
Quantifying gene expression in single cells
Genes are expressed in cells by the synthesis of mRNA molecules. Quantification of gene expression in single cells consists of counting and mapping sequenced reads to each gene in each cell. The outcome of this process is a count matrix, which is a discrete matrix of integers corresponding to the number of RNA molecules associated to each gene and cell. The count matrix usually has genes as rows and cells in columns.
In the next lines we will load the matrix of UMI counts into a variable called pbmc.mtx.
## Loading example data
pbmc_url  <- 'https://github.com/caramirezal/caramirezal.github.io/raw/master/bookdown-minimal/data/pbmc_10X_500_cells.mtx.rds'
pbmc.mtx <- readRDS(url(pbmc_url))
As can be seen from the output of the function dim(pbmc.mtx) the matrix contains 13,714 rows (genes) and columns (cells).
dim(pbmc.mtx)
## [1] 13714 500
To have a glimpse of the appearance of this matrix we print the first 5 rows and first 5 columns. It can be seen that the matrix object is a particular array called sparse Matrix. These types of matrices are specially efficient to store numerical arrays which are very sparse (full of zeroes) as is the case for single cell count matrices data.
pbmc.mtx[1:5, 1:5]
## 5 x 5 sparse Matrix of class "dgCMatrix"
##               AAAGAGACGGACTT-1 AAAGATCTGGGCAA-1 AAAGCAGATATCGG-1
## AL627309.1                   .                .                .
## AP006222.2                   .                .                .
## RP11-206L10.2                .                .                .
## RP11-206L10.9                .                .                .
## LINC00115                    .                .                .
##               AAAGTTTGATCACG-1 AAATCAACCCTATT-1
## AL627309.1                   .                .
## AP006222.2                   .                .
## RP11-206L10.2                .                .
## RP11-206L10.9                .                .
## LINC00115                    .                .
We can start from different types of arrays apart from sparse matrices as data frames or hd5 objects, just to give some examples. The format in which the matrix is provided might also vary from excel files, tsv, csv, rds, etc. Usually this formats can be converted into each other, however, the methods for such transformation are so different and specific that we cannot covered here all of them here.
Quizzes
Manipulation of count matrices
QUIZ 1
*What is the mean and median number of UMI counts in these cells?*
a) median = 301, mean = 343
b) median = 11304, mean = 10432
c) median = 2216, mean = 2354
Answer:
`umi.sum <- apply(pbmc.mtx, 2, sum)`
`summary(umi.sum)`
Min. 1st Qu. Median Mean 3rd Qu. Max.
561 1741 2216 2354 2746 7928
QUIZ 2
a) MALAT1, B2M, TMSB4X, RPL10, RPL13, RPL13A
b) RPL13, MALAT1, B2M, TMSB4X, RPL10, RPL13A
c) B2M, TMSB4X, RPL13A, RPL10, RPL13, MALAT1
QUIZ 3
a) 0.3105930
b) 0.8283542
c) 0.7485923