[BC]2 Tutorial
Defining genomic signatures with Non-Negative Matrix Factorization
Carl Herrmann & Andres Quintero
13 September 2021Selection of optimal factorization rank
A crucial step in data analysis with NMF is the determination of the optimal factorization rank, i.e. the number of columns of the matrix W or equivalently the number of rows of the matrix H. No consensus method for an automatic evaluation of the optimal factorization rank has been found to date. Instead, the decomposition is usually performed iteratively over a range of possible factorization ranks and different quality measures are computed for every tested factorization ranks. Many quality measures have been proposed:
-
The
Frobenius reconstruction error, i.e. the Frobenius norm of the residuals of the decomposition: ||W ⋅ H − V||F -
Criteria to assess the stability of the decomposition:
- The
cophenetic correlation coefficient - An
Amari type distance Silhouette valuesover clusters of patterns extracted iteratively at the same factorization rank
- The
The package ButchR provides a function to visualize all factorization
metrics.
Frobenius reconstruction error
The accesor function FrobError returns a data frame with as many columns as the number of
decomposed factorization ranks and as many rows as there are iterations per
factorization rank.
These residuals are helpful to select the decompostion that is closer to the original matrix.
ButchR will recommend an optimal K value if there is a local minima across the mean Frobenius error of multiple factorization ranks.
FrobError(rna_norm_nmf_exp)
Click for Answer
## [1] "\nNo optimal K found, please select manualy\n"
| k2 | k3 | k4 | k5 | k6 | k7 | k8 | k9 | k10 |
|---|---|---|---|---|---|---|---|---|
| 0.1975693 | 0.1833415 | 0.1671235 | 0.1532516 | 0.1481093 | 0.1340936 | 0.1367746 | 0.1352234 | 0.1176797 |
| 0.1968017 | 0.1816921 | 0.1629583 | 0.1545430 | 0.1470479 | 0.1380185 | 0.1313077 | 0.1300730 | 0.1169848 |
| 0.1973312 | 0.1792726 | 0.1674623 | 0.1527080 | 0.1452187 | 0.1325158 | 0.1341041 | 0.1318661 | 0.1200745 |
| 0.1965124 | 0.1770754 | 0.1614196 | 0.1540932 | 0.1437228 | 0.1324107 | 0.1272746 | 0.1293386 | 0.1176948 |
| 0.1968222 | 0.1763261 | 0.1655435 | 0.1521472 | 0.1438162 | 0.1389070 | 0.1308415 | 0.1295302 | 0.1155311 |
| 0.1977374 | 0.1870041 | 0.1622449 | 0.1507951 | 0.1465456 | 0.1379959 | 0.1390313 | 0.1243427 | 0.1211344 |
| 0.1963016 | 0.1832476 | 0.1610669 | 0.1517311 | 0.1495082 | 0.1414465 | 0.1323888 | 0.1272976 | 0.1230526 |
| 0.1987224 | 0.1787391 | 0.1606174 | 0.1531967 | 0.1403434 | 0.1394498 | 0.1359764 | 0.1341932 | 0.1184785 |
| 0.1974589 | 0.1766975 | 0.1628189 | 0.1513562 | 0.1415927 | 0.1410059 | 0.1366363 | 0.1267888 | 0.1273292 |
| 0.1971803 | 0.1785069 | 0.1713303 | 0.1591989 | 0.1381672 | 0.1319049 | 0.1371715 | 0.1273660 | 0.1233168 |
Factorization quality metrics and optimal K
Besides the Frobenius reconstruction error, ButchR also estimates the cophenetic correlation coefficient, the Amari type distance and Silhouette values.
The values of the computed factorization metrics can be accessed with
OptKStats:
OptKStats(rna_norm_nmf_exp)
Click for Answer
| rank_id | k | FrobError_min | FrobError_mean | FrobError_sd | FrobError_cv | sumSilWidth | meanSilWidth | copheneticCoeff | meanAmariDist |
|---|---|---|---|---|---|---|---|---|---|
| k2 | 2 | 0.1963016 | 0.1972437 | 0.0006984 | 0.0035407 | 19.77115 | 0.9885575 | 0.9773151 | 0.0027460 |
| k3 | 3 | 0.1763261 | 0.1801903 | 0.0035052 | 0.0194528 | 22.77287 | 0.7590957 | 0.8144873 | 0.0533091 |
| k4 | 4 | 0.1606174 | 0.1642586 | 0.0034874 | 0.0212309 | 31.81031 | 0.7952578 | 0.7598790 | 0.0437001 |
| k5 | 5 | 0.1507951 | 0.1533021 | 0.0023846 | 0.0155550 | 25.97285 | 0.5194569 | 0.6734895 | 0.0851761 |
| k6 | 6 | 0.1381672 | 0.1444072 | 0.0035920 | 0.0248740 | 33.09691 | 0.5516152 | 0.6077940 | 0.0875744 |
| k7 | 7 | 0.1319049 | 0.1367749 | 0.0036902 | 0.0269798 | 38.07320 | 0.5439029 | 0.6412591 | 0.0939794 |
| k8 | 8 | 0.1272746 | 0.1341507 | 0.0036326 | 0.0270786 | 34.12018 | 0.4265023 | 0.5583952 | 0.1325817 |
| k9 | 9 | 0.1243427 | 0.1296020 | 0.0033991 | 0.0262273 | 36.35971 | 0.4039967 | 0.6838229 | 0.1413364 |
| k10 | 10 | 0.1155311 | 0.1201276 | 0.0036093 | 0.0300453 | 43.32247 | 0.4332247 | 0.6127411 | 0.1341529 |
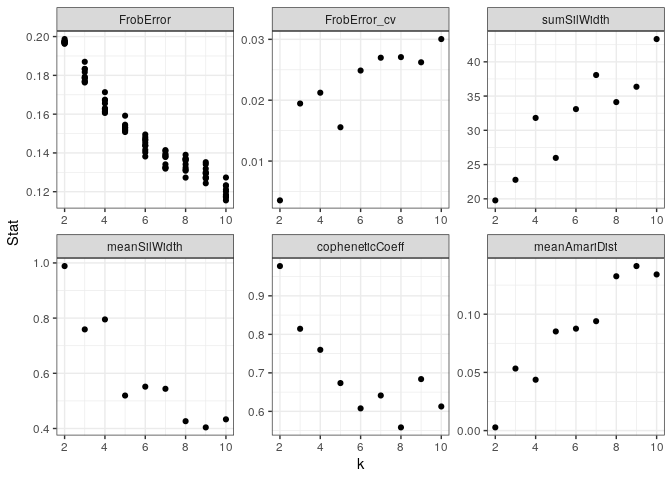
Based on the results of the factorization quality metrics, an optimal number of signatures (k) must be chosen, following these guidelines:
- Minize the Frobenius error, the coefficient of variation and the mean Amari distance.
- Maximize the sum and mean silhouette width and the cophenic coefficient.
## Plot K stats
gg_plotKStats(rna_norm_nmf_exp)
Click for Answer